Code
install.packages("gganimate")Static visualizations that are publication ready are readily available in R using the ggplot2 package. However, there are times where it’s required to illustrate the change in an event overtime. This is a particular use case of the gganimate package in R which is an extension of the ggplot2 package for creating animated ggplots.
It provides a range of functionalities that can be added to the plot object in order to customize how it should change with time.
The gganimate package is available on CRAN and it can be installed by running the code chunk below from the Rstudio console.
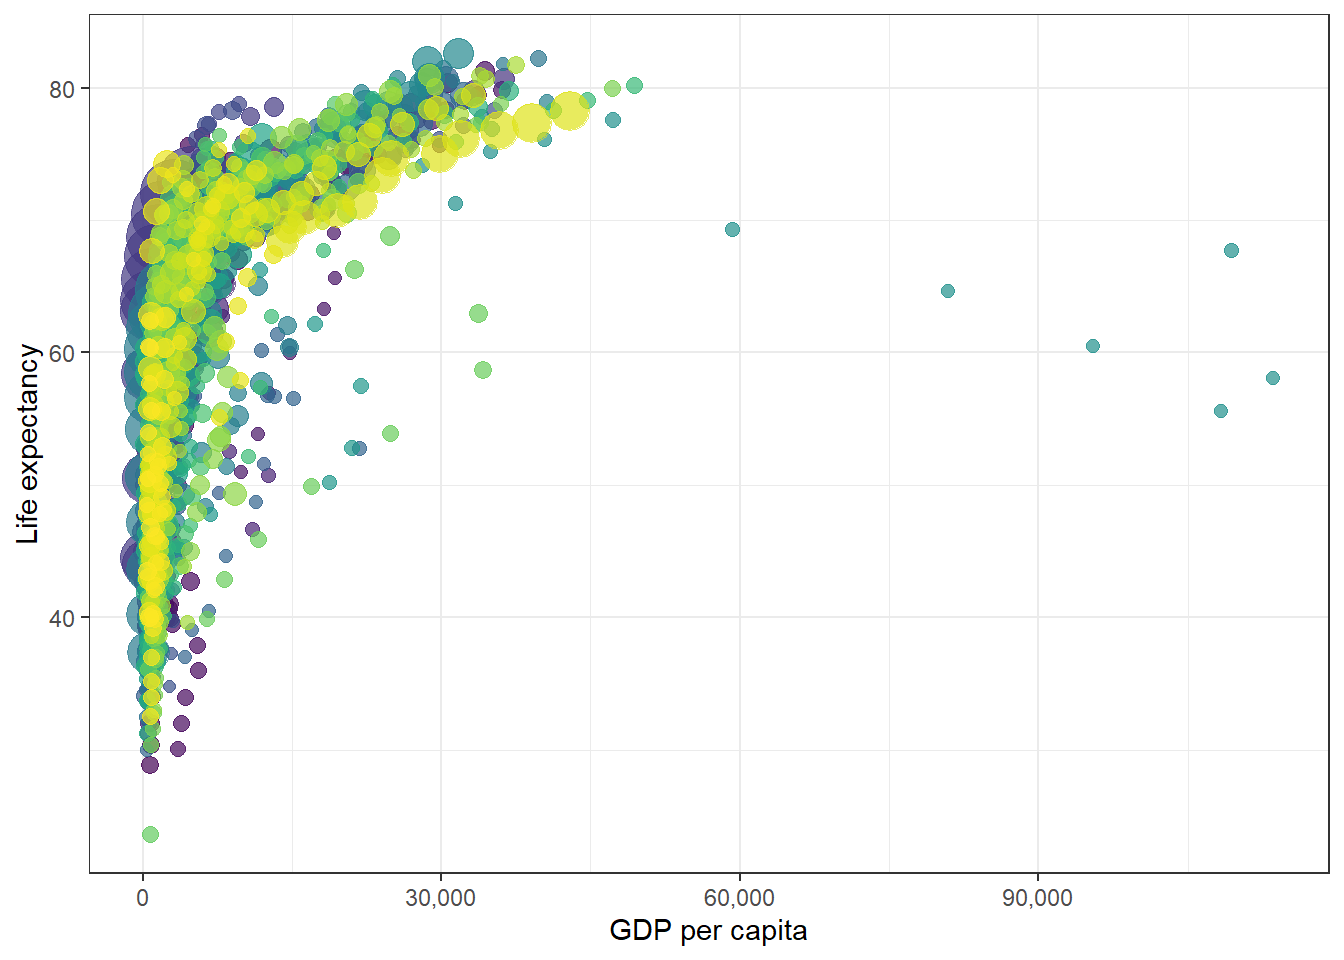
install.packages("gganimate")The gapminder dataset in R is an excerpt of the Gapminder data on life expectancy, GDP per capita, and population by country.
The gapminder package is available on CRAN and it can be installed by running the code chunk below from the Rstudio console.
install.packages("gapminder")if(!require(pacman)) install.packages("pacman")Loading required package: pacmanWarning: package 'pacman' was built under R version 4.0.5pacman::p_load(
tidyverse,
gganimate,
gapminder
)
theme_set(theme_bw())data(gapminder)gapminder dataset, below is the structure of the dataset which includes the variables and sample data.glimpse(gapminder)Rows: 1,704
Columns: 6
$ country <fct> "Afghanistan", "Afghanistan", "Afghanistan", "Afghanistan", ~
$ continent <fct> Asia, Asia, Asia, Asia, Asia, Asia, Asia, Asia, Asia, Asia, ~
$ year <int> 1952, 1957, 1962, 1967, 1972, 1977, 1982, 1987, 1992, 1997, ~
$ lifeExp <dbl> 28.801, 30.332, 31.997, 34.020, 36.088, 38.438, 39.854, 40.8~
$ pop <int> 8425333, 9240934, 10267083, 11537966, 13079460, 14880372, 12~
$ gdpPercap <dbl> 779.4453, 820.8530, 853.1007, 836.1971, 739.9811, 786.1134, ~Key R function: transition_time().
Label variables: frame_time.
p + transition_time(year) +
  labs(title = "Year: {frame_time}")
Warning: No renderer available. Please install the gifski, av, or magick
package to create animated outputNULLCreate facets by continent:
p + facet_wrap(~continent) +
  transition_time(year) +
  labs(title = "Year: {frame_time}")
Warning: No renderer available. Please install the gifski, av, or magick
package to create animated outputNULLLet the view follow the data in each frame
p + transition_time(year) +
  labs(title = "Year: {frame_time}") +
  view_follow(fixed_y = TRUE)
Warning: No renderer available. Please install the gifski, av, or magick
package to create animated outputNULLpop_ng <- gapminder %>%
filter(country == "Nigeria") %>%
ggplot(aes(x = year, y = pop, fill = pop)) +
geom_bar(stat = "identity", show.legend = FALSE) +
scale_fill_distiller(palette = "Reds", direction = 1) +
theme_minimal() +
theme(
panel.grid = element_blank(),
panel.grid.major.y = element_line(color = "white"),
panel.ontop = TRUE
) +
scale_y_continuous(labels = scales::unit_format(unit = "M", scale = 1e-6)) +
geom_text(aes(label = paste0(round(pop/1000000,1), "M")))
pop_ng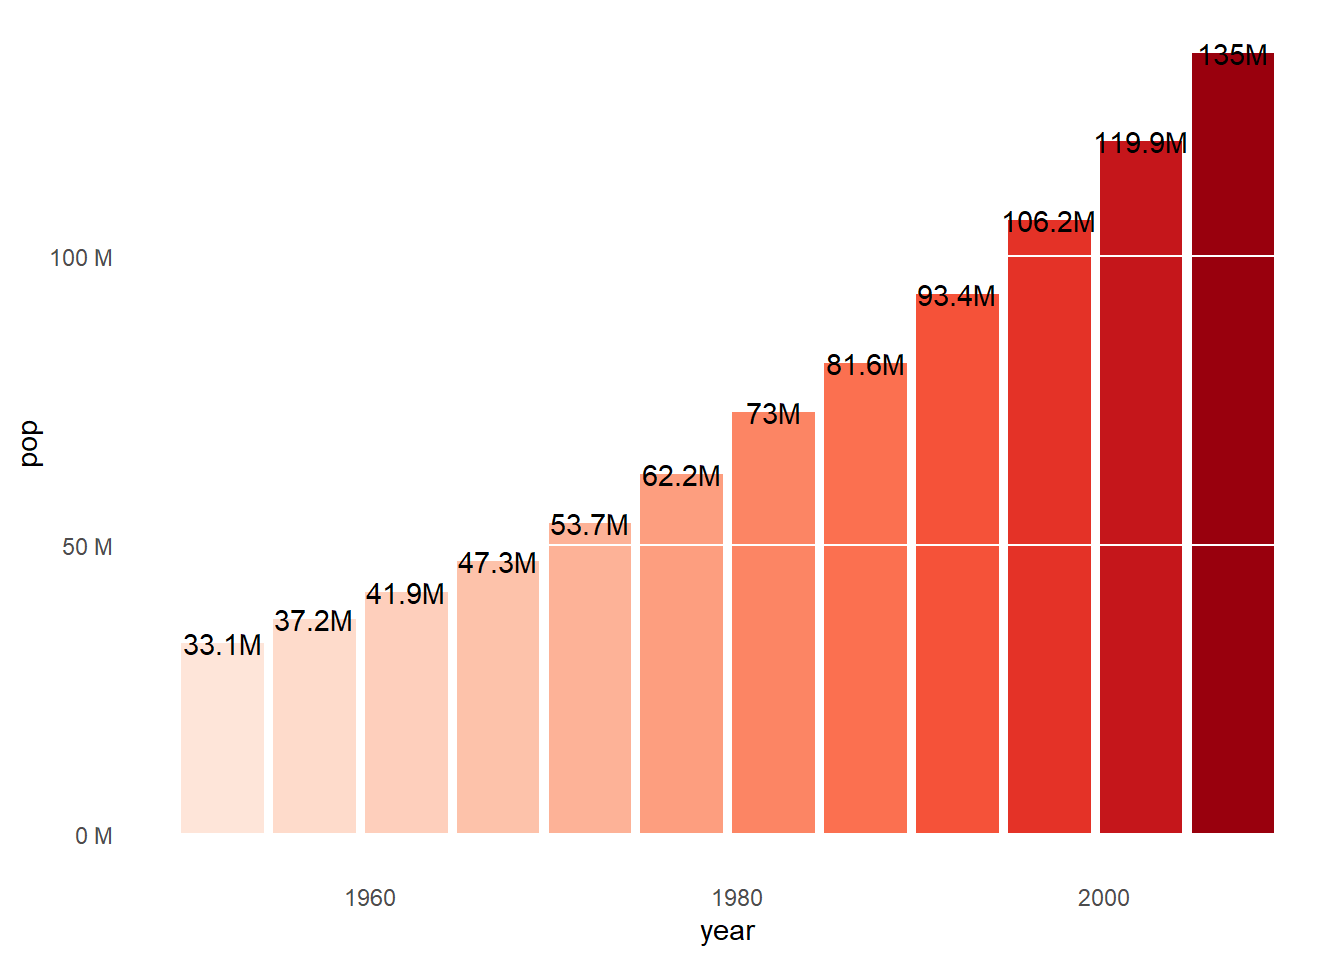
pop_ng + transition_time(year) +
  shadow_mark() +
  labs(x = "Year",
       y = "Population",
       title = "Year: {frame_time}")
Warning: No renderer available. Please install the gifski, av, or magick
package to create animated outputNULLIf you need to save the animation for later use you can use the anim_save() function.